
Designing an IoT diagram is a skill that you will need to pick up and get familiar with when working with system/network deployments, especially in designing and presenting industry-grade solutions within the industry, as you will be architecting solutions and showing your thought processes behind certain design choices. The technical depth of your design will also differ from user to user. For example, a CIO might not care that much about the full list of services that you use on AWS to ingest, process, and analyze data that you have obtained on your sensor and have sent to be processed; rather, they would just like to see how it works overall. The technical depth may be more suited for an engineering manager or another developer on the team to help them better understand the design choices that are being proposed and why certain choices have been made. This will also serve as a reference for you to go back to when considering which parts of the architecture you can revise in the future.
In this section, we will start by looking at two high-level design flows: one for the flow of a smart lightbulb’s communication with a user interface and one for a design flow that is based on AWS. In the following chapters, we will be discussing how to create more complex diagrams, so this will help you get used to how these flows can be represented and what the best practices are to make them presentable to your target audience.
A high-level design flow for a smart lightbulb
In this diagram, we can see the design flow of how a smart lightbulb communicates to reach the user interface:
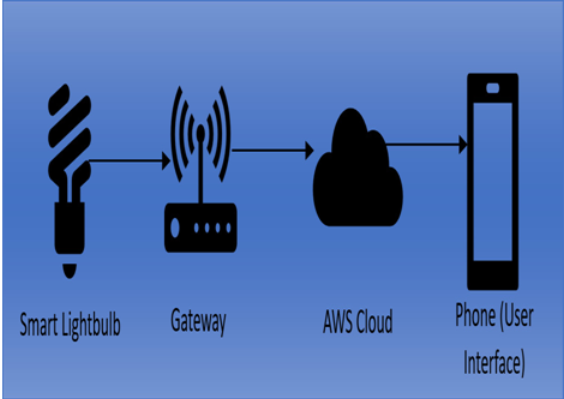
Figure 1.8 – Communication flow diagram of a smart lightbulb
To start off with, we can assume that we have a smart lightbulb that is able to detect a change to its state; that is, when it is turned on and off. The smart lightbulb—fitted with a sensor—communicates its ON status to the gateway. This gateway can be a Wi-Fi router, which then transmits the status to the AWS cloud. The AWS cloud then uses a service such as Amazon Simple Notification Service (SNS), which sends a notification to the user’s phone stating the lightbulb has been turned on.
This simple flow illustrates at a high level the communication flow. As you can already tell by seeing the picture and reading the description (or if you are already familiar with AWS), we have omitted illustrating the services that oversee receiving and delivering the communication from the gateway and to the phone. As mentioned, we have intended this to be a high-level overview of the process. In the next chapters, you will see more of the inner workings of the infrastructure and learn about how the message gets passed through more deeply.
Now, here are a couple of exercises for you to try out yourself:
Draw a diagram that illustrates the flow of a smart fridge alerting a user’s laptop that it is currently empty
Draw a diagram that illustrates a user’s phone alerting another phone through AWS that it is lost
For your drawings, you can find a lot of tools either offline or online that can help you draw properly. Some tools that you can use for this may be the following:
Draw.io and Lucidchart: Both are great free online tools that you can use to create different types of diagrams.
Draw by hand: You can create drawings by hand, although it is best to do so digitally to make them easily editable and presentable later. In industry-based settings, drawings are almost always done digitally.
Microsoft Word and PowerPoint: These are great and convenient to make diagrams and sketches on due to the availability of different shapes and icons that you can search for, although it’s hard to make them scalable later.
Note that there are no correct or wrong answers here; simply design sample diagrams based on the technologies and flows that you have learned within this chapter!